* WIP: add scheduler commands

* refactor scheduler commands page

* WIP on CRUD for ScheduledCommands

* more refactoring, finish CRUD On scheduled pages

* Add info text about Scheduler service

* Finish recurring commands add/edit

* add more texts

* fix server status behavior on not-loaded-yet state; adjust texts; lint fixes

* add link to the help pages in the commands palette

* Move Commands Panel to ServerSchedulesPage

* Rename Server Schedules to Server Actions

* more texts, a bit changed visual of the actions page, lint fix

* add docs

* fix tests

* Add UTC label to scheduled command create/edit
3.6 KiB
etke.cc-specific components
This directory contains etke.cc-specific components, unusable for any other purposes and/or configuration.
We at etke.cc attempting to develop everything open-source, but some things are too specific to be used by anyone else. This directory contains such components - they are only available for etke.cc customers.
Due to the specifics mentioned above, these components are documented here rather than in the docs, plus they are not supported as part of the Synapse Admin open-source project (i.e.: no issues, no PRs, no support, no requests, etc.).
Components
Server Status icon
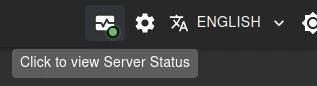
In the application bar the new monitoring icon is displayed that shows the current server status, and has the following color dot (and tooltip indicators):
- 🟢 (green) - the server is up and running, everything is fine, no issues detected
- 🟡 (yellow) - the server is up and running, but there is a command in progress (likely maintenance), so some temporary issues may occur - that's totally fine
- 🔴 (red) - there is at least 1 issue with one of the server's components
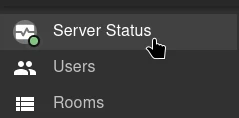
The same icon (and link to the Server Status page) is displayed in the sidebar.
Server Status page

When you click on the Server Status icon in the application bar, you will be redirected to the Server Status page. This page contains the following information:
- Overall server status (up/updating/has issues)
- Details about the currently running command (if any)
- Details about the server's components statuses (up/down with error details and suggested actions) by categories
This is a Monitoring report
Server Notifications icon
![]()
In the application bar the new notifications icon is displayed that shows the number of unread (not removed) notifications
Server Notifications page

When you click on a notification from the Server Notifications icon's list in the application bar, you will be redirected to the Server Notifications page. This page contains the full text of all the notifications you have about your server.
Server Actions Page
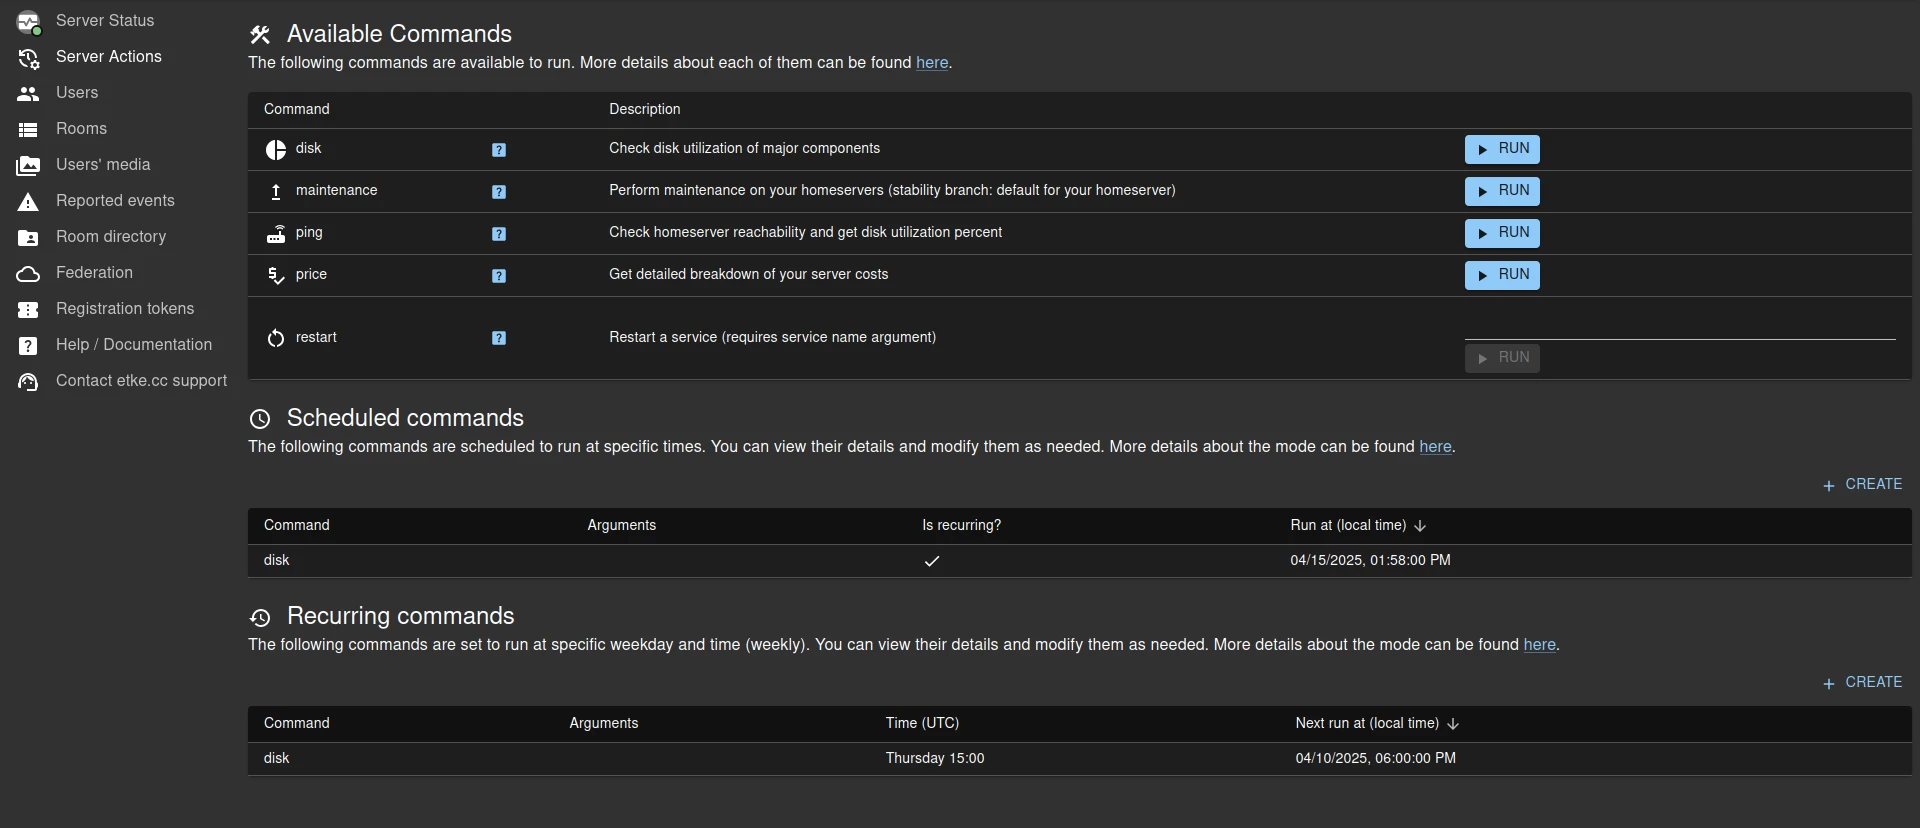
When you click on the Server Actions sidebar menu item, you will be redirected to the Server Actions page.
On this page you can do the following:
- Run a command on your server immediately
- Schedule a command to run at a specific date and time
- Configure a recurring schedule for a command to run at a specific time every week
Server Commands Panel
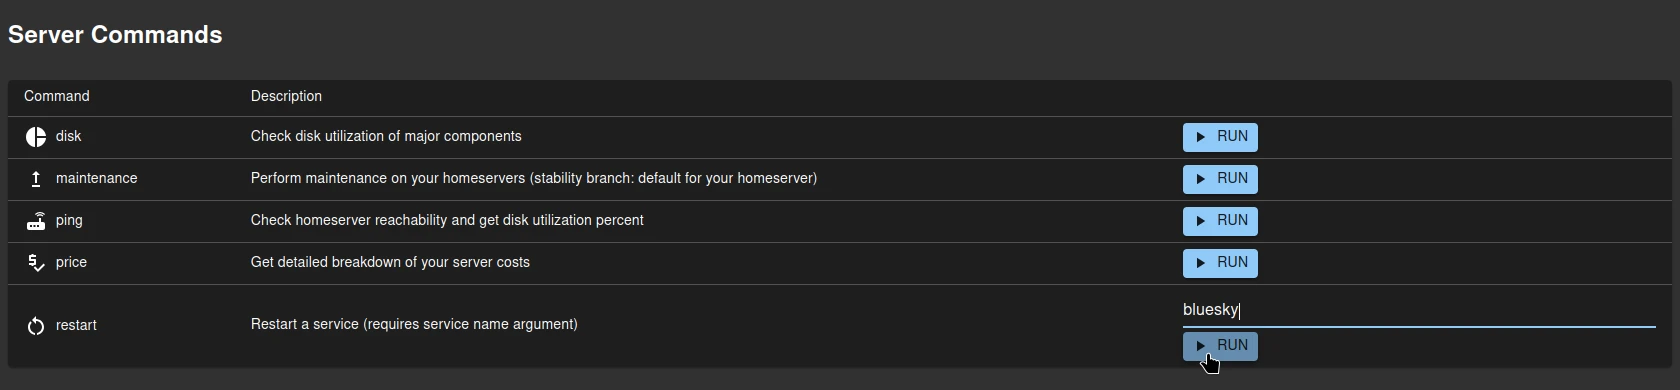
When you open Server Actions page, you will see the Server Commands panel. This panel contains all the commands you can run on your server in 1 click. Once command is finished, you will get a notification about the result.